Scientists Agree that Global Warming is happening and that we are the Cause

Super fact 34: Climate Scientists agree that Global Warming or if you call it Climate Change is happening, and that it is caused by us primarily because of our burning of fossil fuels. There is a long-standing scientific consensus on these two facts because the evidence is conclusive. Typically, studies show an agreement of at least 97% or 98% among climate scientists.

This is a super fact because surveys show that this is not what the public believes and yet it is true. The public incorrectly believes that there is a large disagreement among scientists on this topic. A note, to understand why the evidence is conclusive as to why global warming is happening and is caused by us click here.

Note : I will use the term “global warming” in this review. Whether you call the phenomenon climate change, climate disruption, or global heating, is not important.

The Scientific Consensus

This extensive survey from 2013 of 12,000 climate papers (papers published over two decades) by Dana Nuccitelli and Cook, etc., concluded that 97.1% of climate scientists endorsed the consensus position that humans are causing global warming.

They also did a science author self-rating which concluded that 97.2% of climate scientists endorsed the consensus position that humans are causing global warming. Another conclusion from the survey was that the consensus had increased from around 90%, perhaps less, in the early 1990’s.

A later review of six independent, peer-reviewed studies examining the scientific consensus about global warming have concluded that between 90% and 100% of climate scientists are convinced human-caused global warming is happening. A more recent study (2021) found that as many as 98% of climate scientists are convinced global warming is happening and is human-caused. Numerous other surveys have concluded the same thing.

People’s Beliefs About Global Warming

This 2024 survey from Yale University show that most Americans (61%) understand that global warming is mostly human caused. By contrast, 28% think it is caused mostly by natural changes in the environment. Most Americans (58%) <<Link-6>> understand that most scientists think global warming is happening. This percentage has trended generally upward since this survey began in 2008. By contrast, about one in five (22%) think there is a lot of disagreement among scientists about whether global warming is happening.
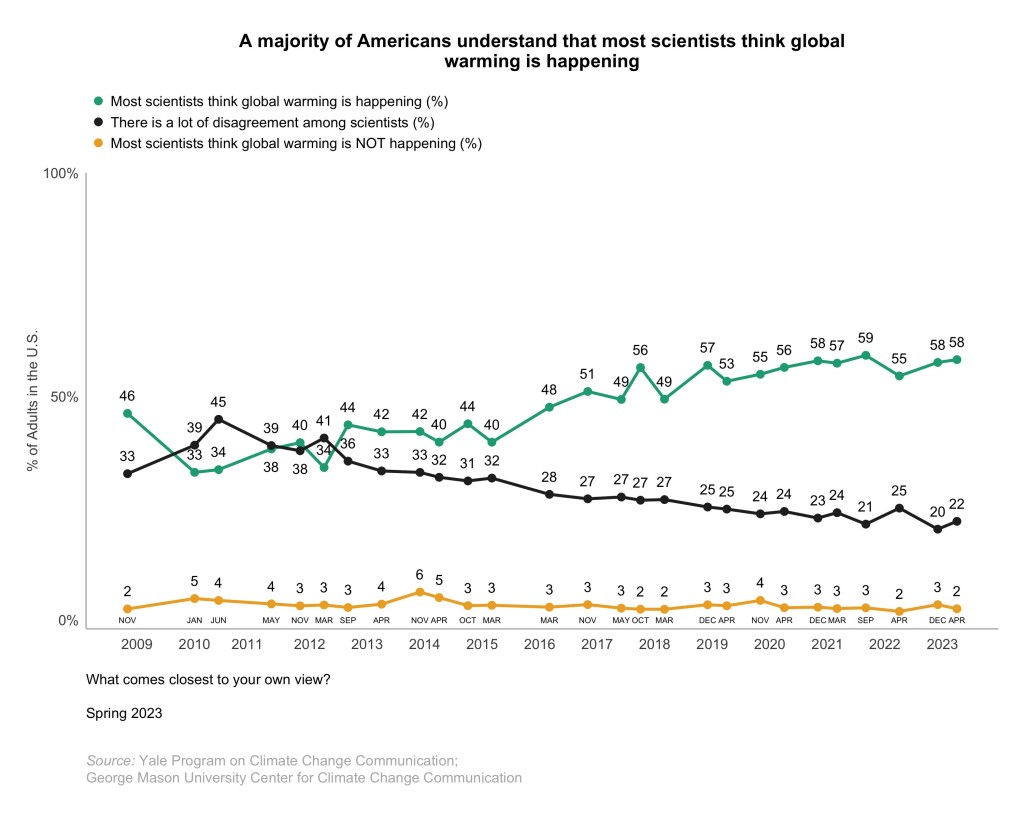
The green graph corresponds to “most scientists think global warming is happening (%).” The black graph corresponds to “there is a lot of disagreement among scientists (%)”. The yellow graph corresponds to “Most scientists think global warming is NOT happening (%)”. Graph taken from the Yale Program on Climate Change Communication.

However, only one in five Americans (20%) understand that nearly all climate scientists (more than 90%) think that human-caused global warming is happening. The aforementioned Dana  Nuccitelli refers to this in his book Climatology versus Pseudoscience as the consensus gap. Again, this large discrepancy between public perception and reality makes the consensus gap a super fact. Research has shown that this discrepancy has a large impact on people’s other beliefs regarding global warming.
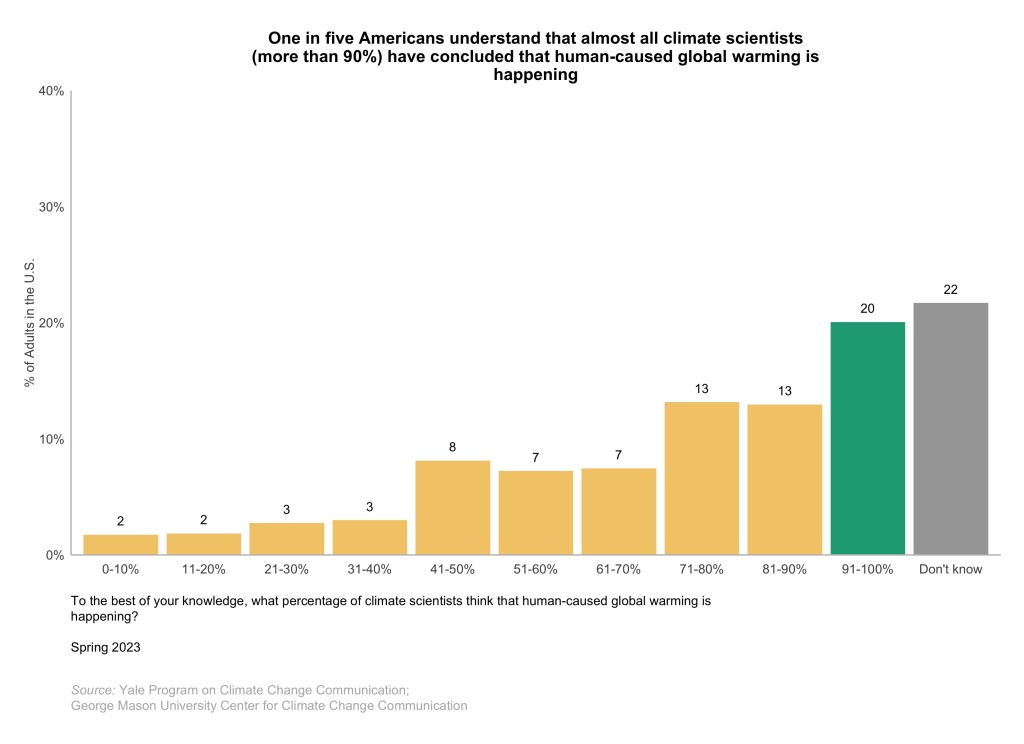
The question was, To the best of your knowledge what percentage of climate scientists think that human-caused global warming is happening? Graph taken from the Yale Program on Climate Change Communication.

Why is there a Consensus Gap?

In his book Climatology versus Pseudoscience Dana Nuccitelli explains that a relatively small group of so-called climate skeptics, or more accurately called climate contrarians have received a lot of attention from media. Even though their science is bad, and they’ve published their error ridden papers in obscure or discredited journals, and the fact that their predictions have failed repeatedly many times over, they have had an enormous influence on public discourse. Conservative politicians, and many talk show hosts are blindly devoted to their falsehoods, whilst real scientists are being attacked.

It is not just rightwing media who are using them for their purposes, but mainstream media are giving the contrarians undue attention as well. Sensationalism is one issue. A science contrarian claiming that all the climate scientists are wrong, and that he is the only one who finally got it right is a lot more interesting of a story than a repeat of the consensus. Another issue is false balance. Journalist should not feel that they must give equal time to evidence-based science and nonsense, but that is often the case. To read my review of this book click here.

The Oregon Petition

I am mentioning the Oregon petition because I fell for it myself. The Oregon petition was an official looking petition circulated by climate contrarians, claiming that there is no evidence that human-caused global warming will cause catastrophic heating of earth’s atmosphere and disruption of earth’s climate, and that adding more carbon dioxide to the atmosphere would even be beneficial for plants and animals. It got an impressive number of signatures, 32,000 after some years.

However, it turned out that the signatories rarely had climate expertise, and were not scientists, and the survey listed many falsified names such as the names of the Spice Girls and several fictional characters. Less than 200 of the signatories were climate researchers.

It was a con, but it was touted in a lot of media as the truth. I saw it over and over and I believed it. I was later surprised to learn that it was a con and that a scientific consensus existed on global warming / climate change. Learning that I had been bamboozled on this matter was one of the red flags that prompted me to start doing some fact checking on the issue global warming.

To see the other Super Facts click here

Many Popular Environmental Actions Are Ineffective

Super fact 33: Actions such as eating locally, buying organic produce, using paper straws, and recycling can be good for the environment but can also be worse for the environment and these actions often have a much smaller positive impact than alternative rarely considered actions. What are popular actions for the environment is often different from what is effective.

I consider this a super fact because the beliefs regarding what is good for the environment and what is bad for the environment and what has a significant impact and what has not, are often based on popular trends and culture rather than knowledge. We need to educate ourselves. Following trends is not the answer to good stewardship of the planet.

This content was generated by an Artificial Intelligence (AI) system. Asset id: 2531547331

Is Locally Grown Food Really Better for the Environment?

As I explained in this post eating locally is not necessarily ecological. Agricultural products that are grown off season or in non-native environments are often grown in greenhouses, which require a lot of energy and generate significantly more emissions than shipping the produce across oceans would. This is especially true for crops like tomatoes, cucumbers, mangoes and bananas, that require warmer climates to be grown in open fields.

From pexels.com by Julia Nagy.

In some cases, the crop requires significant water resources or chemical inputs to thrive and may not be suitable for warmer climates, for example, apples. Some crops, like avocados or almonds require a lot of water but despite that they are grown in dry places like California (80% of California’s freshwater is used for agriculture). From an environmental perspective it would be better to grow these crops in a suitable environment and then transport them.

Is Eating Organic Really Good for the Environment?

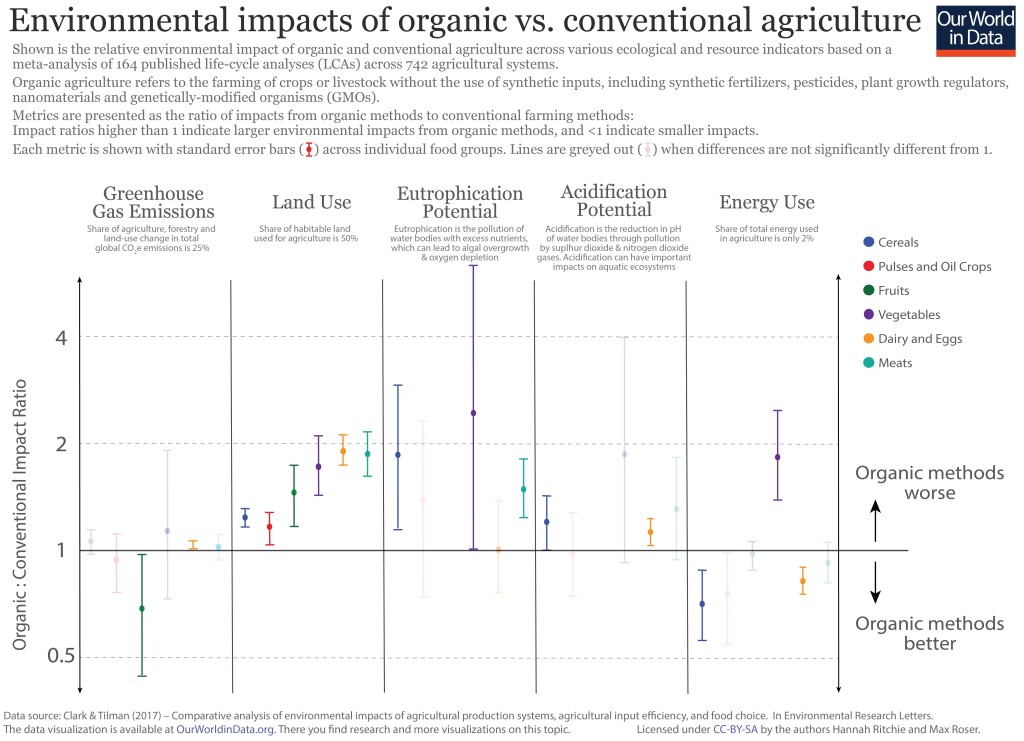
As explained in this post eating organic is not necessarily ecological. Despite strong public perception of organic agriculture producing better environmental outcomes, conventional agriculture often performs better on environmental measures including land use, greenhouse gas emissions, and pollution of water bodies. There are, however, some contexts where organic agriculture may be better for the environment.

The graph below gives an overview of the environmental impact of various types of crops grown organically and conventionally. As you can see organic crop often require double as much land compared to conventionally grown crops. It is complicated.

Shown is the relative environmental impact of organic and conventional agriculture across various ecological and resource indicators based on a meta-analysis of 164 published life-cycle analyses (LCAs) across 742 agricultural systems. Roughly, lower in the graph means organic is better and higher up in the graph means conventional farming is better. Data source: Clark & Tilman (2017) – Comparative analysis of environmental impacts of agricultural production systems, agricultural input efficiency, and food choice. In Environmental Research Letters. The data visualization is available at OurWorldinData.org<<Link-10>>. There you can find research and more visualizations on this topic. Licensed under CC BY-SA by the authors Hannah Ritchie and Max Roser.

What really matters though is the type of food you eat, not whether it is organic or not. For example, beef (from beef herd) causes emissions 188 times larger than nuts do for the same amount of protein provided. Another thing to note is that if you eat 300 steaks per year you will have a 100 times larger environmental impact from your meat eating compared to someone who eats 3 steaks per year. You don’t have to become a vegetarian to have a smaller environmental impact but quantity matters.

Is Recycling Important?

The common perception that recycling is one of the best things you can do for the environment is not correct. Its impact is often not very large and if not done properly it can be counterproductive. If you throw a greasy pizza box in the recycling, you can ruin the entire batch.

Surveys across 21,000 adults in 30 countries showed that the two actions among twelve that people believed saved the most greenhouse gases were recycling (59%) and upgrading lightbulbs (36%). As it turns out, those two saved the least greenhouse gases among the twelve options. The option saving the most greenhouse gases among the 12 was giving up an SUV, which saved 18 times as much greenhouse gases as recycling. 17% of respondents picked that one.

Photo by Anna Shvets on Pexels.com

According to Our World in Data (and the book Not the End of the World page 114<<Link-6>>), which is based on this research, giving up an average SUV for a sedan would save 3.6 metric ton, or 22.5% of the carbon emissions for the average American. Switching to a plant-based diet would save 2.2 metric ton per person, or 13.8%. Recycling comes in at a savings of 0.2 metric tons according to the same data. EPAs estimates are slightly higher but still low in comparison.

Plastic straws versus paper straws

Producing a plastic straw requires 39 kilojoules of energy and produces 1.5 grams of carbon dioxide emissions. However, producing a paper straw requires 96 kilojoules of energy and produces 4.1 grams of carbon dioxide emissions. So, plastic straws are better for the environment from that perspective. However, this could be compared to a typical passenger vehicle, which emits about 4.6 metric tons of CO2 per year according to EPA. That corresponds to more than 3 million plastic straws and more than one million paper straws.

According to the same article the average passenger vehicle emits about 400 grams of CO2 per mile. So, driving just one mile corresponds to hundreds of plastic straws and paper straws.

Photo by Christopher on Pexels.com
Photo by Sarah Chai on Pexels.com

One advantage of paper straws is that they are easier to recycle, at least under ideal circumstances. Unfortunately, they often get soggy, and recycling plants don’t want that so they often throw them out. Another advantage is that paper straws decompose and don’t end up in our ocean.

However, not only are straws very small items, most of the plastic pollution in the ocean does not come from north America(1%) or Europe (1%). Paper straws versus plastic straws seem like a complex riddle but it may not be an important one. Whether you drive more or drive less is probably a lot more important.

Plastic bags versus paper bags

As with plastic straws versus paper straws plastic bags versus paper bags is a complicated question. From an environmental perspective they both have advantages and disadvantages. Plastic bags are less carbon intensive to produce, are easier to reuse several times, and the production of plastic bags require on average four times less energy than the production of paper bags.

On the other hand, paper bags are decomposable and easier to recycle. However, the chemicals and fertilizers used in producing paper bags create additional harm to the environment. It is a complicated question.

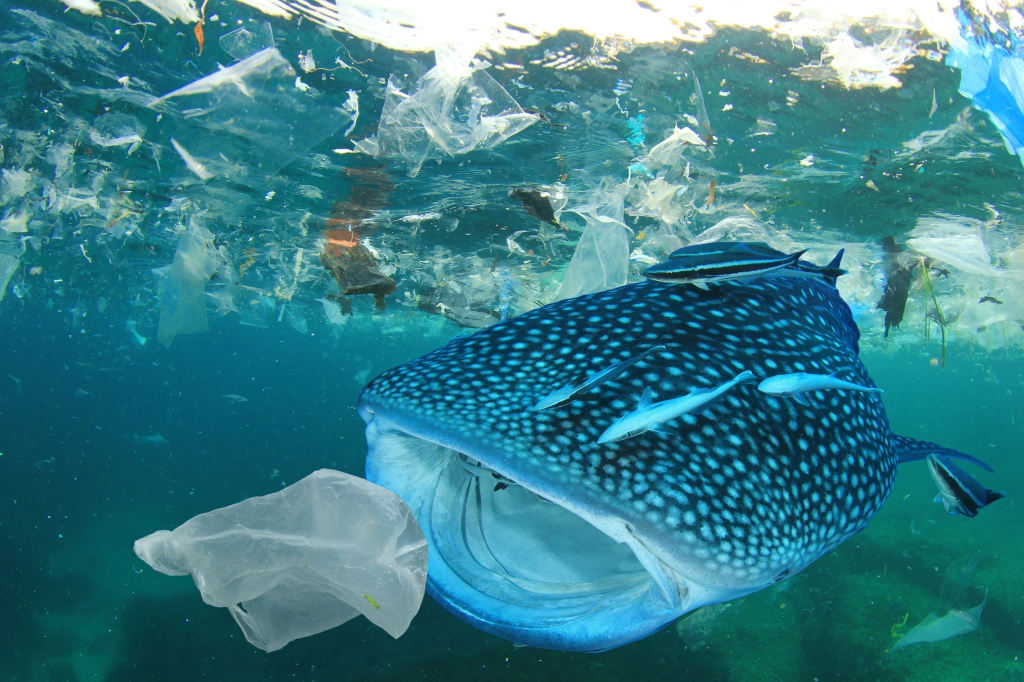
Plastic Ocean pollution. Whale Shark filter feeds in polluted ocean, ingesting plastic. Asset id: 1120768061 by Rich Carey

Having a Significant and Positive Impact on the Environment

Some of the allegedly sustainable practices and actions mentioned above are counter productive and others have a very small effect, for example, carbon emissions savings that are a few grams. According to the “Our World Data” and the book “Not the End of the World” page 114, a compilation of data research, some actions that you can take that will significantly reduce carbon emissions are  (savings in metric tons per year, for flight it is per trip):

  • Giving up an SUV 3.6 tons
  • Go car free (average car) 2.4 tons
  • Switch to plant-based diet 2.2 tons
  • Avoid transatlantic flights 1.6 tons
  • Buy green energy 1.5 tons
  • Switch to electric car (from average sedan) 1.2 tons
  • Switch from electric car to none 1.2 tons
  • Avoid medium flight 0.6 tons (1,700 miles each way going and returning)
  • Laundry in cold water 0.25 tons
  • Hand-dry clothing 0.2 tons
  • Recycle 0.2 tons
  • Upgrade light bulbs 0.1 tons

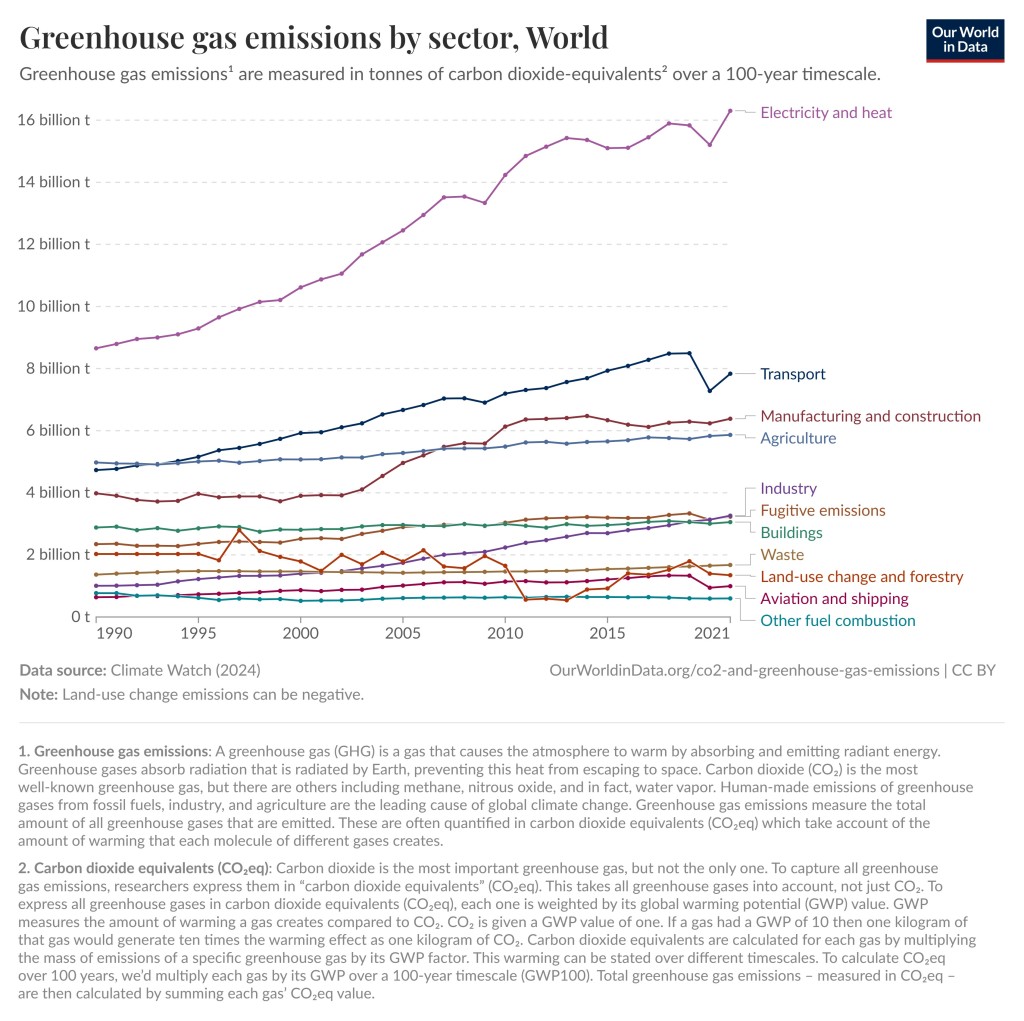
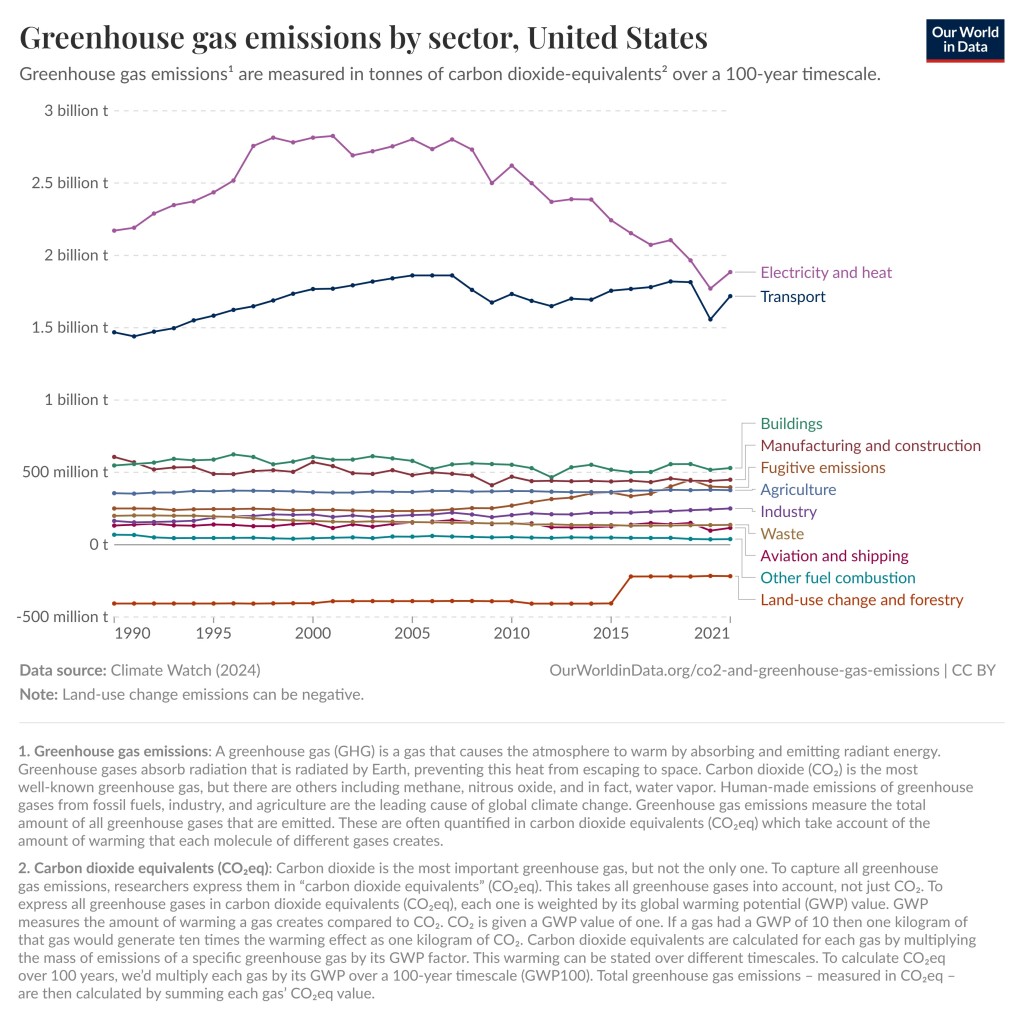
As you can see in the graphs below, the largest contributor of greenhouse gas emissions in the World and in the United States is electricity and heat. Unfortunately, the composition of the electric grid is something we as consumers have very little control over. We can save energy, get solar panels for our roof, or buy our electricity from green energy companies, but we cannot easily change the composition of the grid. Energy companies and politicians must do that.

However, we can make our voices heard by calling and writing to our representatives. This might be the single most impactful action that you as an individual can take. Your congressman, senator, or state legislator will probably not read your letter. They have hundreds of thousands or millions of constituents and get lots of letters every day. What is likely to happen is that a staff member will skim the letter and note the concern in a database.

Just make sure that your letter is politely written so it does not go in the wastebasket. Also make sure that you are a constituent. Writing to Ted Cruz when you live in Florida is not going to have an impact. They are interested in finding out what the concerns of their constituents are and according to staff members and other information I have come across, this really has an impact.

Data source : Climate Watch (2024). Note : Land use emissions can be negative. OurWorldinData.org/co2-and-greenhouse-gas-emissions| CC BY
Conclusion

The survey mentioned above showed that among the twelve environmental actions an individual could take, the one with the second to smallest positive impact was the one that the majority thought had the biggest positive impact, despite it having a relatively tiny impact. The actions that could really make a huge difference were hardly considered.

We, the public, are very bad at determining what is good or bad for the environment and what has a significant and positive impact or not, even though the data is out there and we easily can look it up. Maybe the biggest positive impact one could have on the environment is to look up the facts and get better educated.

To see the other Super Facts click here

Environmental Benefits of Recycling Are Overestimated

Super fact 32: The common perception that recycling is one of the best things you can do for the environment is an exaggeration. Its impact is often not very large and if not done properly it can be counterproductive.

In general recycling is beneficial, because you conserve natural resources, reduce climate change, save energy and reduce waste and pollution. Battery recycling is particularly important since it reduces toxic waste and reduces the risk of a future shortage of certain minerals. Recycling is often viewed as a very important activity that everyone should participate in, and neighbors often shame those who fail to comply.

The shocking news is that even though recycling in general is good for the environment it may not be as beneficial as it is assumed. It turns out to be complicated. As you will see later, most people think that recycling is the most impactful action you can take as an individual to reduce carbon emissions, when in fact it is of very marginal importance. This is what made me consider this a super fact.

This content was generated by an Artificial Intelligence (AI) system. Asset id: 2531547331

Recycling and Greenhouse Gases

According to EPA recycling saves 193 million metric tons of carbon emissions, which sounds a lot until you consider that the US emit 6,343 million metric tons per year according to EPA making it 3%. According to this website consumers can save 732 kilograms of CO2 assuming they do the recycling correctly. This should be compared to the average carbon footprint for an American (US), which is 16 metric tons, making the savings for good recyclers 4.6%.

According to our World in Data (Not the End of the World page 114), based on this research, giving up an average SUV for a sedan would save 3.6 metric ton, or 22.5%. Switching to a plant-based diet would save 2.2 metric ton per person, or 13.8%. Actions saving more greenhouse gases than recycling that we as consumers can take, are for example: give up SUV, go car free, have a plant-based diet, avoid transatlantic flights, buy green energy, switch to electric car, switch from electric car to no car, avoid medium flights, laundry in cold water, and hand dry clothing.

Surveys across 21,000 adults in 30 countries showed that the two actions that people believed saved the most greenhouse gases were recycling (59%) and upgrading lightbulbs (36%). Upgrading lightbulbs have an even smaller effect than recycling. It is of course still a good action to take.

However, what this data demonstrates is that we are bad at guessing which actions are impactful. We need to get better informed and not make assumptions. It should be noted that the efficiency of the recycling efforts varies from country to country. Among the 32 developed countries for which there is data the United States ranks 25.

Recycling and Plastic Waste

Greenhouse gas emissions is certainly not the only issue to consider. What about plastic waste? As it turns out plastic is very difficult to recycle (depending on the kind of plastic) and according to the EPA less than 9% of plastic is recycled. According to Our World in Data and the book “Not the End of the World” by Hannah Ritchie the US and Europe have well managed landfills and good waste management systems that make our plastic problem less of an issue. That’s good news.

But what about the awful problem with plastic in the ocean? Plastic ending up in the ocean is indeed a bad problem. However, 81% of all plastic in the ocean come from Asia, and the rest mostly comes from Latin America. Only 1% come from the United States and 1% from Europe and Oceania. According to Scientific American 93% of plastic in ocean come from just 10 rivers. Eight of them are in Asia: the Yangtze; Indus; Yellow; Hai He; Ganges; Pearl; Amur; Mekong. Two are in Africa – the Nile and the Niger.

None of them are in North America or Europe. Therefore, if we in the developed world greatly improve our recycling of plastic, it would not make much of a difference with respect to the problem of plastic in the ocean. What we need to do is assist China, India and southeast Asia with improving their waste management systems.

Plastic Ocean pollution. Whale Shark filter feeds in polluted ocean, ingesting plastic. Asset id: 1120768061 by Rich Carey

Another issue to keep in mind is that uneducated consumers can do a lot of damage to the recycling process. For example, throwing a greasy pizza box into the recycling bin can ruin the entire batch. You are not just recycling incorrectly you are ruining the recycling efforts of your neighbors too. There are many ways to ruin the recycling process, by throwing items in the recycling that don’t belong there. Recycling requires consumers to pay attention to the instructions. It should also be noted that some companies have been found to ignore the recycling process and throw all recycled items in with the trash. There are also neighborhoods that don’t have recycling.

Conclusion

In summary, recycling may not be as great as it is often made out to be. You should still do it if you care about the environment. Just be aware that there are actions that you can take and that your government can take that are much more impactful.

One of the conclusions you can draw from this discussion is that if you are driving a big SUV or eating red meat every day you should probably abstain from shaming your neighbor for not recycling.

To see the other Super Facts click here

The Hockey Stick Graph is not Wrong

Superfact 26: The disputed Hockey Stick Graph showing that recent global warming is unprecedented in the context of the past thousand years has been shown to be correct.

The Mann, Bradley, and Hughes hockey stick curve published in 1998 in Nature and showing a sharp upturn in global temperatures in recent years as well as relatively flat temperatures in the previous 1,000 years, ignited a firestorm.

Initially some scientists criticized it for being wrong, and the rightwing media and think tanks, and especially politicians criticized the graph and even attacked the scientists involved accusing them of being frauds. Al Gore was harshly criticized for using the hockey stick in his documentary “an inconvenient truth”. There were congressional hearings, politicians intimidating scientists, fake scandals, threats, and lawsuits.

The propaganda campaign against the hockey stick graph succeeded in winning over the public and that included me. I was for the longest time convinced that the hockey stick graph was wrong and perhaps a fraud. I was wrong. I had been bamboozled just like large segments of the American public.

The scandal around the hockey stick curve and the related climate-gate (fake scandal) was used to question the entire concept of global warming / climate change. As you may know, the evidence clearly shows that global warming is happening and is caused by us.

It should be noted that the way Mann, Bradley, and Hughes implemented their statistical analysis was not 100% correct, but the discrepancy was very small and did not make a big difference. However, this discrepancy was very useful for their detractors.

The controversy led to an investigation resulting in the so-called North Report. The 2006 North Report published by the United States National Academy of Sciences endorsed the MBH studies with a few reservations.

Subsequent research has resulted in more than two dozen reconstructions, using various refined statistical methods and combinations of proxy records. They are not identical to the original hockey-stick graph but closely resemble it and consistently show a slow long-term cooling trend changing into relatively rapid warming in the 20th century.

Since there is now a scientific consensus supporting the hockey stick graph, it is important news, and a lot of people still have not gotten the memo or are refusing to believe it, I consider it a super fact.

Before The Hockey Stick Graph

Before the hockey stick curve there was a lot of talk about the medieval warm period and the little ice age. Many people used these periods to cast doubt on global warming claims by scientists. I should say that the climate scientists claim about global warming was not based on the temperature record for the last 1,000 years. It was because the observed recent uptick in average global temperatures was not expected naturally.

Their worries were based on the fact that our greenhouse gas emissions could explain the uptick whilst there was no climate cycle or natural phenomenon that could explain it. That combined with the fact that the manner in which the warming was happening (it’s fingerprint if you will) showed that it was our greenhouse gases causing it.

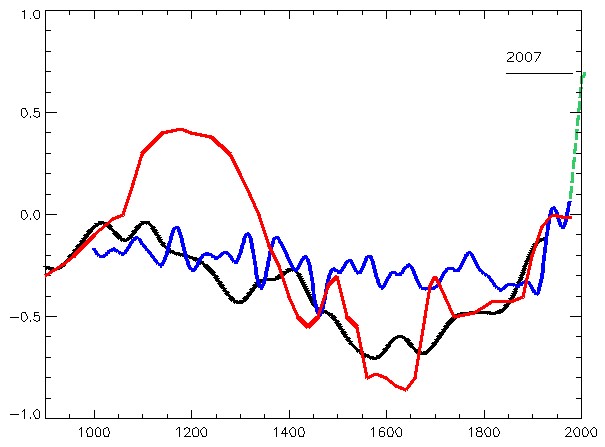
So, the comparably high temperatures during the medieval warm period and the very cold temperatures during the little ice age should not have mattered much. But as you can see in the graph below, the old temperature graphs could be used by global warming skeptics.

It should be noted that previous estimates for the temperatures during the medieval warm period and the little ice age were based insufficient data and guesstimates.

The graph below from the 1990 IPCC report shows three curves, a red, a blue and a black one, and a green extension to the blue from 1998 to 2007. The red graph shows a large bulge corresponding to the medieval warm period, a significant drop corresponding to the little ice age, and a minor uptick in recent temperatures. The blue curve shows a flattened medieval warm period with only a minor little ice age and sharper uptick in recent temperatures. The green extension stretching from 1998 to 2007 shows a significantly sharper uptick in temperatures. The black curve is an alternative temperature curve by Moberg.

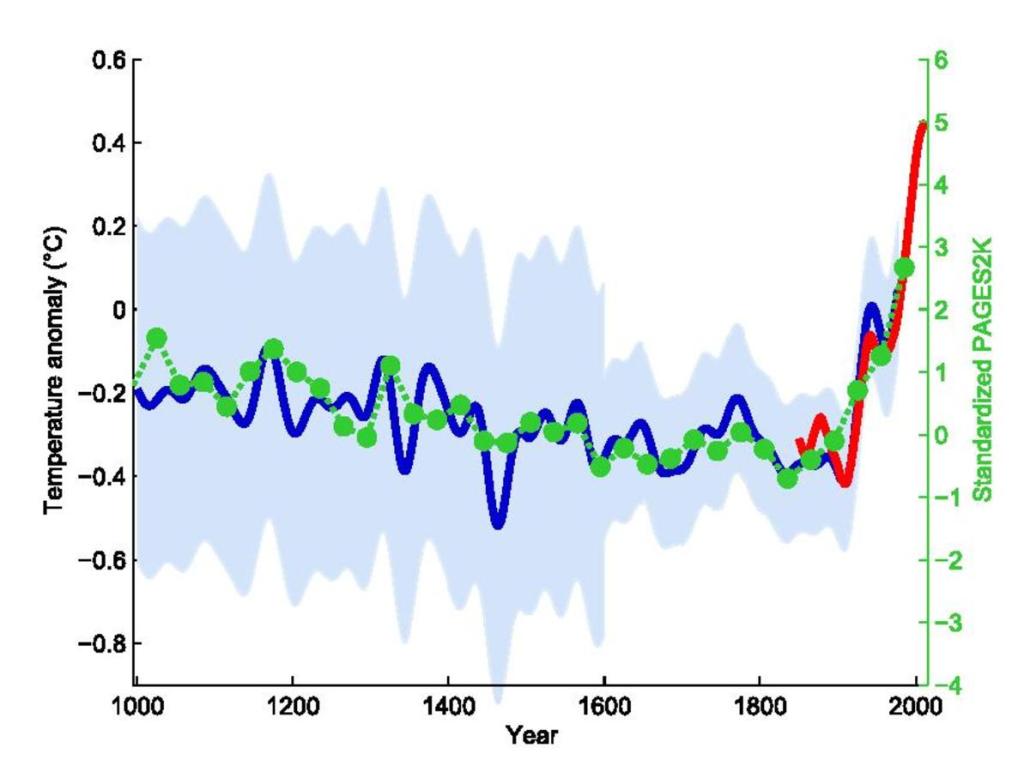
As you can see the estimates for the average global temperatures during the medieval warm period and little ice age were too large. When the hockey stick curve came along (next graph), a propaganda tool was diminished, which led to the media storm.

The red line is from the 1990 IPCC report and shows what was believed at the time about temperatures during the last 1,000 years. The blue line is the (MBH) hockey stick graph from 1998. Graph taken from this page. William M. Connolley derivative work: Dave souza, CC BY-SA 3.0 <http://creativecommons.org/licenses/by-sa/3.0/&gt;, via Wikimedia Commons
The so-called hockey stick curve depicting the last 1,000 years. The blue line is the first hockey stick curve ever created (by Michael Mann). He used proxy measurements such as tree rings, green-dots 30-year average, red temperature measurements. Wikimedia commons <<https://creativecommons.org/licenses/by-sa/4.0/deed.en>>. This graph is taken from this page.

Multiple Hockey Stick Graphs

As mentioned, various refined statistical methods and combinations of proxy records, has resulted in another couple of dozen hockey stick curves that largely agree with the original MBH hockey curve. Below are a few examples taken from various sources. The first two graphs below are taken from the real climate website, a website created by climate scientists.

IPCC 3rd Assessment Report

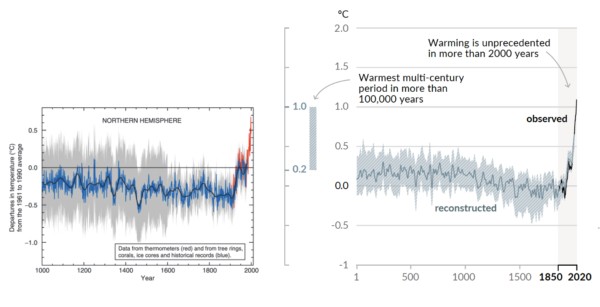
Side-by-side comparison of the (left) original Mann et al (1999) “Hockey Stick” reconstruction as featured in the Summary for Policy Makers of the IPCC 3rd Assessment report (2001) and the (right) longer, sharper “Hockey Stick” as featured in the Summary for Policy Makers of the IPCC 6th Assessment report (2021).

Eight Hockey Sticks by New Scientist

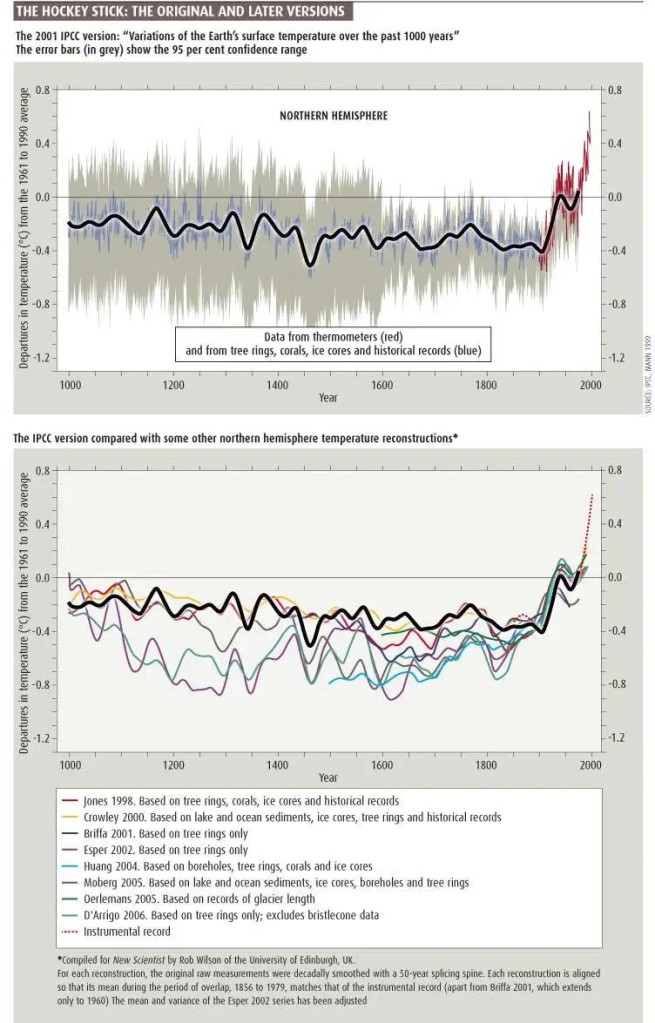
The graphics below are focused on the northern hemisphere. The top graph shows the 2001 IPCC hockey stick curve with data from thermometers (in red). Below that graph are eight more hockey stick curves plus a red dotted line corresponding to the instrumental record. This was compiled for New Scientist by Rob Wilson of the University of Edinburgh, UK.

The top graph shows the 2001 IPCC version of the hockey stick curve stretching back 1,000 years. The error bars (in grey) show the 95% confidence range. The blue line is from tree rings, corals, ice cores and historical records. All curves correspond to the departures in temperatures in centigrade from the 1961 to the 1990 average.

The Hockey Stick Wars

I also wanted to add a few examples related to the propaganda wars against the first hockey stick graph and its author Dr. Michael Mann and climate science in general. If you haven’t followed this topic, I can add that it did get intense.

On April 23, 2010, Virginia Attorney General Ken Cuccinelli issued a Civil Investigative Demand (CID) to the University of Virginia (UVA). The CID demanded that UVA provide every email, record, or document it had related to Dr. Mann from his time there from 1999 to 2005. This resulted in a strong reaction from the scientific community.

On 2 March 2012 the Supreme Court ruled that Cuccinelli as Attorney General had no legal authority to demand the records from the university. Dr. Mann was also severely harassed and received chilling death threats against himself as well as his family, as documented in his book “The Hockey Stick and the Climate Wars: Dispatches from the Front Lines”.

In February 2024, Michael Mann won a defamation lawsuit against conservative writers Rand Simberg and Mark Steyn (Mann v. Competitive Enterprise Institute). The jury awarded Mann $1 million in punitive damages and $1 in compensatory damages. The lawsuit was over blog posts written by Simberg and Steyn that accused Mann of manipulating data in his famous “hockey stick” graph. It was not so much about questioning the science but rather about the fact that they intentionally tried to ruin his reputation using false information.

For example, they were comparing him to the infamous pedophile Jerry Sandusky. Jerry Sandusky was a football coach at Penn State University and Dr. Michael Mann is a distinguished Professor of Atmospheric Science at Penn State.

To see the other Super Facts click here

Wind power is not a major cause of bird death

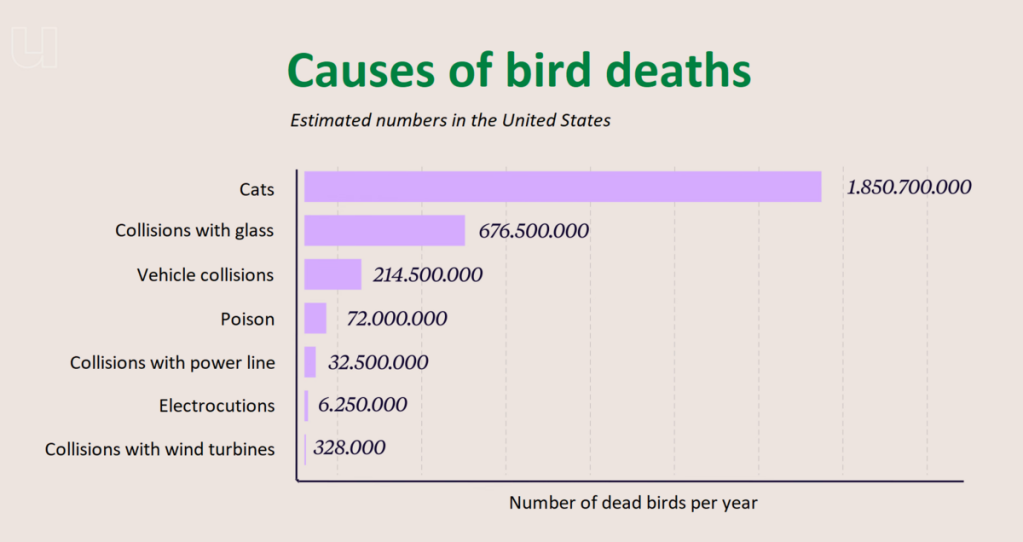
Superfact 17: Fossil fuels kill a lot more birds per gigawatt hour than wind power does. Cats, windows, cars, poison and powerlines are examples of things that kill a lot more birds than wind power does. Wind power killing birds is not the huge environmental problem it is often made out to be.

Wind power killing birds is often mentioned as a slam dunk environmentally based argument against wind power and evidence for the hypocrisy of environmentalists. This is misguided. Wind power killing birds is a real problem and it should be addressed, and it is being addressed. No energy source comes without environmental problems. However, wind turbines account for only a small fraction of overall bird deaths compared to other human causes. It is not a good argument against wind power, and it does not demonstrate any hypocrisy by environmentalists. In fact, a study made in 2012 (overview here) concluded that fossil fuels killed 24 million birds per year in the US, which correspond to 35 times more birds per GWh than wind power kills according to this study. Even though this study and other similar studies are estimates based on assumptions that are far from perfect, they are good indicators that replacing fossil fuels with wind power likely saves birds rather than kills them.

Photo by Pixabay on Pexels.com

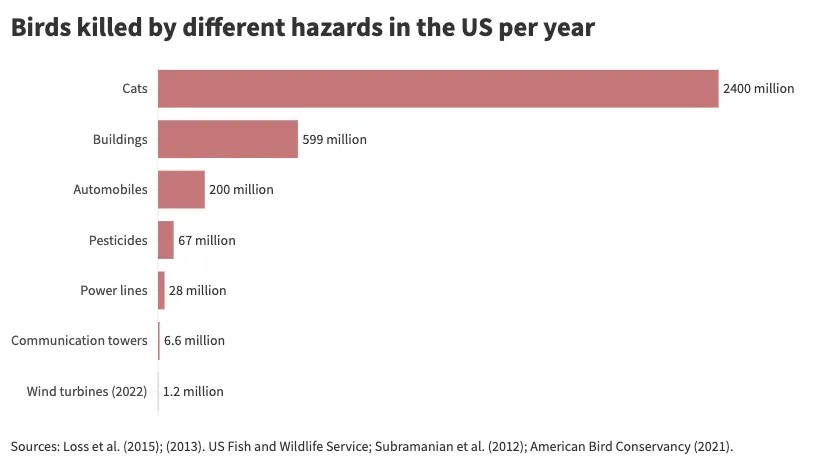
In any case, as this Wikipedia article states, collisions with wind turbines are a minor source of bird mortality compared to other human causes. According to the graph below cats kill 5,600 times more birds than wind power and collisions with powerlines kills 99 times more birds than wind power, and yet we rarely discuss these problems. Even though these numbers are estimates they are mostly confirmed by other studies and analysis, as this overview from MIT and this analysis by Hannah Richie shows. The numbers aren’t the same, but they make the same point. FYI Hannah Richie is the deputy editor and lead researcher at Our World in Data. Our World in Data is a scientific online publication that focuses on large global problems. They are associated with Oxford University and is one of the most respected statistics, analysis and research organizations in the world.

From Wikipedia: Universiteit van Nederland, CC BY 3.0 <https://creativecommons.org/licenses/by/3.0&gt;, via Wikimedia Commons
An alternative graph taken from Hannah Richie / Our World in Data, using alternative sources essentially showing the same thing. Sources: Loss et al. (2015), (2013), US Fish and Wildlife Service; Subramnayan et al. (2012), American Bird Conservancy (2021).

Wind power has been on the receiving end of false claims, nonsense, and strange rumors for quite some time. It is not the only energy source maligned by false information, but it is an interesting case study in misinformation regarding energy sources. To read about nonsense and rumors about wind power click here.

Photo by Athena Sandrini on Pexels.com


To see the other Super Facts click here