The goal of this blog is to create a long list of facts that are important, not trivia, and that are known to be true yet are either disputed by large segments of the public or highly surprising or misunderstood by many.
Superfact 16: Wind power is providing more than a quarter of Texas Power. In 2023, wind represented 28.6 percent of Texas energy generation. In 2022, wind power accounted for about 25 percent of Texas’ energy generation.
I am referring to this fact as a super fact because, it is true, important, and yet it’s a fact that is difficult to believe for many people. That wind power, allegedly a marginal energy source, is successful in fossil fuel loving Texas is hard to believe. I have come across what appears to be well informed people who were certain it was nonsense. However, as you can see from the Texas government links above, it is true, something they could not dispute.
The reason for the success of wind power in Texas is economics, which is another fact that may be surprising to some. Fossil fuels are a major source of income for us in Texas, but everyone also wants to save money. Texas has its own electric grid, it’s deregulated, and organized along free market principles.
When companies sell their energy (to ERCOT) it works like a continuous auction. The one with the lowest price is picked first and allowed to contribute with whatever they are able to and also, of course, considering what the grid-powerlines can carry safely. Naturally, the price of wind in Texas includes federal subsidies, which make it even cheaper.
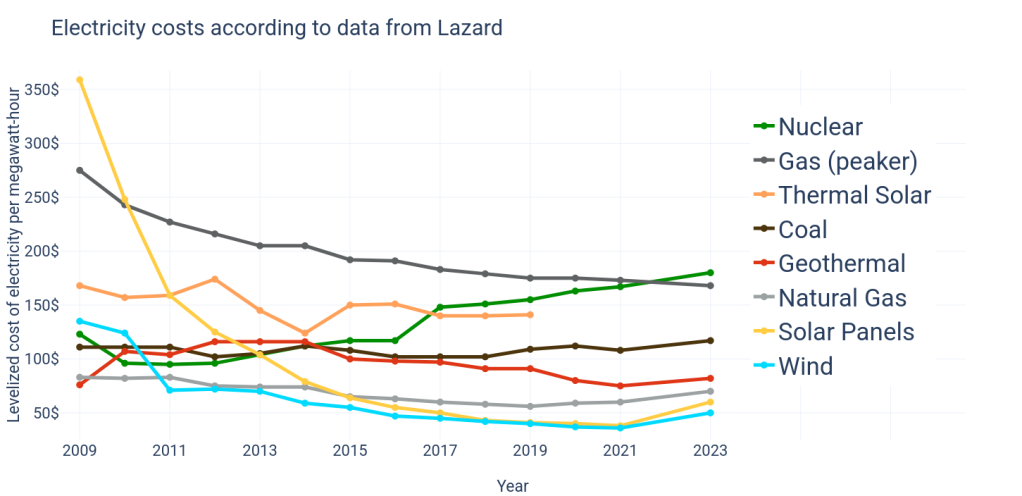
However, all energy sources are subsidized, and fossil fuels have a long history of government subsidies. Below is the average unsubsidized levelized cost of energy according to Lazard. Levelized means that construction costs, land rent, and other costs not directly caused by electricity generation are taken into consideration. Notice how cheap wind is (blue line). This is for the United States not just Texas. I don’t have any numbers, but I’ve heard that for Texas solar is the cheapest .
Average unsubsidized levelized cost of energy. Notice that the light blue line indicates that wind power is pretty cheap. Mir-445511, CC BY-SA 4.0 <https://creativecommons.org/licenses/by-sa/4.0>, via Wikimedia Commons.
Affordability
Windpower is not only relatively cheap. Wind power is one of the most efficient and sustainable energy sources available. The energy required to manufacture, install, and maintain wind turbines is small compared to the energy they produce over their lifespan. This is known as their energy return on investment (EROI), which is quite favorable for wind energy.
The Institute of Environmental Management and Assessment (IEMA) states that the average wind farm will pay back the energy that was used in its manufacture within 3-5 months of operation. This article in the journal Renewable Energy found that the average windfarm produces 20-25 times more energy during its operational life than was used to construct and install its turbines. It included data from 119 turbines across 50 sites going back 30 years.
It is important to be aware that there are many false claims floating around about wind power. The sound from wind power stations does not cause cancer, it does not use any other energy sources while operating; it solely harnesses the kinetic energy from the wind to generate electricity, meaning it only relies on wind to function as its primary energy source. Windpower is not a major cause if bird deaths. To read more about false claims about wind power click here.
There are positive and negative aspects of wind power, like any other source of energy. One issue with wind power (and solar) is that it is an intermittent source of energy. When the wind is not blowing you need other sources of energy (until there is sufficient energy storage). This is less of a problem when you have a mix of energy sources as Texas does.
Superfact 12: The United States is both a Republic and a Democracy
I believe that most people do not find that statement surprising in the least. When I became a citizen of the United States, through naturalization (I am originally from Sweden), I had to learn about the US government, and I was told by the US government officials that the United States is both a Republic and a Democracy.
However, I’ve come across a lot of people who state something like “The United States is a Republic and therefore not a Democracy” as if being a Republic and a Democracy are mutually exclusive. Well, as this article explains it is not. To be very specific, the United States is a “federal constitutional representative democracy.” Because the United States is indeed both a Republic and a Democracy and yet many would dispute that fact, I consider this to be a super-fact.
This is an article from the United States Citizenship and Immigration Services on the topic that confirms that the United States is a Republic and a Democracy. This is an article from NPR on the topic. This is what the Wikipedia entry on the United States says under the headline “Government and politics” “It is a liberal representative democracy “in which majority rule is tempered by minority rights protected by law.””
The United States is a representative democracy. Photo by Brett Sayles on Pexels.com
It should be noted that United States is not a Direct Democracy, like ancient Greece, but it features some aspects of it in referendums. Just like most democracies around the world. Another thing to note is that the Economists Intelligence Unit downgraded the United States from a full democracy to a flawed democracy in 2016. But it is still a democracy.
Is the United States a democracy?
If you ask google / AI this question “Is the United States a democracy?”. The answer you get is:
The United States is a representative democracy. This means that our government is elected by citizens. Here, citizens vote for their government officials. These officials represent the citizens’ ideas and concerns in government.
When I asked ChatGPT the same question (Is the United States a democracy?) I got this answer:
Yes, the United States is considered a democracy, but more specifically, it is a representative democracy or democratic republic. In a pure democracy, citizens directly vote on all laws and policies. In a representative democracy, like in the U.S., citizens elect officials (such as members of Congress, the president, and local representatives) who make decisions and pass laws on their behalf.
The U.S. system is also based on the principles of constitutional democracy, where the rule of law, individual rights, and the separation of powers (between the executive, legislative, and judicial branches) are foundational. The Constitution guarantees these principles, which are designed to protect minority rights while allowing majority rule through democratic elections.
In summary, the U.S. combines democratic elements with a framework that ensures checks and balances to prevent abuses of power.
The United States Capitol Building in Washington DC. Photo by Patrick Morris on Pexels.com
Partisan politics aside, the consensus seems to be that the United States is both a Republic and a Democracy.
Superfact 9 : We are living in relatively peaceful times
Despite all the wars going on, the world was filled with a lot more war and violence in the past. Despite the grim news reports we are living in relatively peaceful times.
If I asked you, what are the two biggest wars going on the world today (as of September 2024), you would probably say that it is the Russia / Ukraine war and the Israel / Gaza war. Well, unless you are really well informed, it would come as a surprise that there are more devastating wars going on in the world. For example, there is currently a big civil war going on in Sudan that began in April 2023.
According to the latest issue of the Economist perhaps 150,000 people have been slaughtered in this civil war, and 10 million people have fled their homes, and a famine is emerging that could kill 2.5 million people by the end of the year. This war is likely to destabilize neighboring countries and is sponsored by Russia and Middle Eastern states. It’s likely the biggest crisis in the world but most likely you’ve never heard of it.
In the recent Tigray war in Ethiopia between 162,000 and 600,000 people were killed according to Wikipedia. The Tigray war is mostly over, but the point I am trying to make is that you probably have never heard of it. You cannot use the impressions given by the amount of media attention a conflict gets to decide on how severe it is. You’ve got to check the statistics and compare, and the statistics might be quite unintuitive if you have relied on media attention as a metric.
What was the most devastating war in the 19th century?
So, to the next question. What was the most devastating war in the 19th century? If you say the American civil war, you are not correct (estimated 650,000+ deaths). A somewhat better answer is the Napoleonic wars (and estimated 4 million deaths). But none of the answers are correct. The Taiping rebellion in China was the worst. Estimates of the conflict’s death toll range between 20 and 30 million people. Some estimates say 100 million, which would make it the most devastating war in human history.
But did you hear about it? Again, you’ve got to check the statistics, and not rely on your impressions. I am saying this because the claim that deaths from wars and violence have declined over the last few decades is a quite unintuitive claim and yet it is true. That’s why it is a super fact.
Taiping Rebels at Shanghai China in 1853-54. ‘Small Swords’ refers to daggers used by warriors or martial artists in close combat. 19th century print. Stock Illustration ID: 237232531 by Everett Collection.
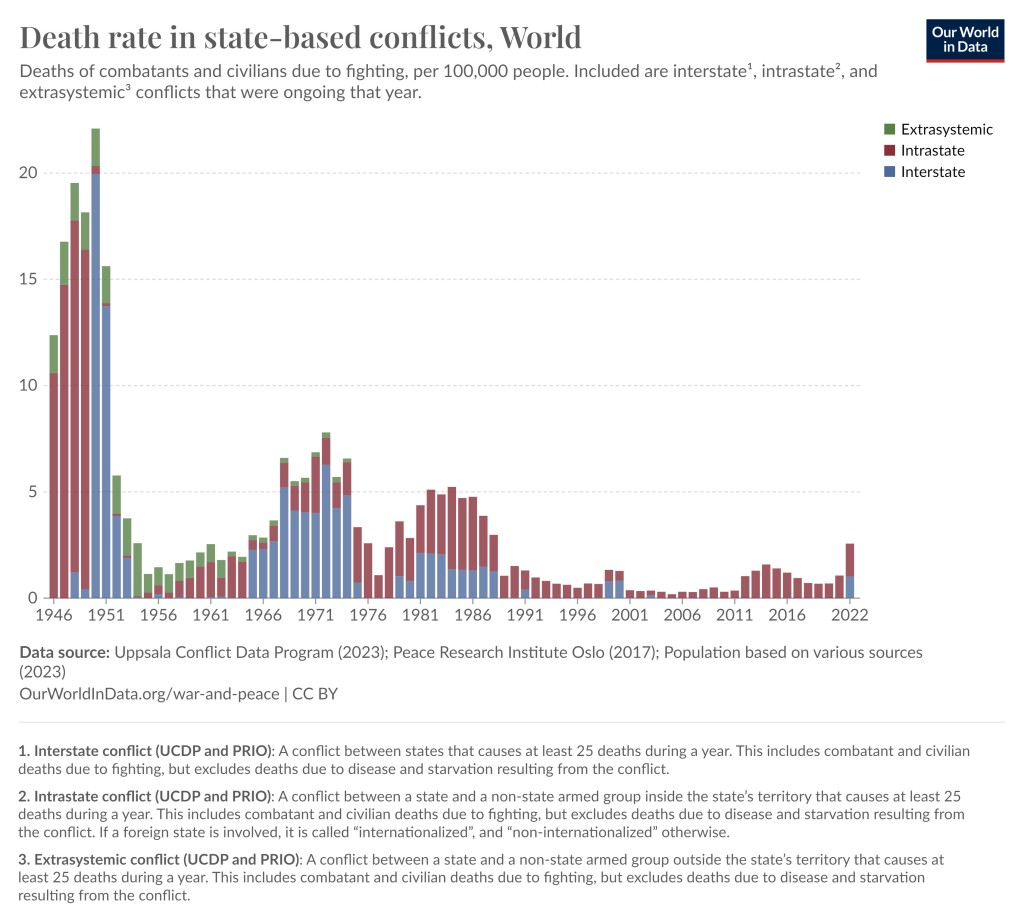
As this article in the Our World In Data states “While every war is a tragedy, the data suggests that fewer people died in conflicts in recent decades than in most of the 20th century. Countries have also built more peaceful relations between and within them.”. It should be noted that even though killing has never been as efficient as it is in the present, in the past a lot of civilians died from famine and disease resulting from the wars.
For example, the Spanish flu following World War I killed between 25 to 50 million people. I should say those numbers are typically not included in the deaths from World War I. The number of deaths from World War I are estimated at 20 million. 10 million combatants and 10 million civilians.
Death rate from wars since 1946. The uptick in 2022 is largely due to the Ethiopian Tigray war with 162,000–600,000 killed and the invasion of Ukraine, which US and BBC estimates at more than 200,000 deaths (but estimates from most other sources are less).
One problem with this kind of statistics is that the estimates vary, especially with respect to civilian causalities. In addition, very big wars lasting a few years create very bumpy graphs with large spikes making it harder to identify trends.
However, by listing estimated war deaths of the biggest wars, genocides and democides since the 1800’s you can see that deaths from this type of violence have overall been reduced over the last few decades. A note, democides are mass killings of civilians but are not necessarily directed at an ethnic group (democide include genocide).
The links below are mostly from Encyclopedia Britannica, but also from Wikipedia, the Census bureau, and a couple of other sources.
As I said, the numbers are estimates and not hard data, especially with respect to civilian casualties. However, you can see a trend going from several conflicts with numbers in the tens of millions before 1950, then numbers in millions until 2000/2007 and then during the last couple of decades the numbers have been less than a million. This does not cover homicide rates but even in that case we can see a reduction even though it is less distinct.
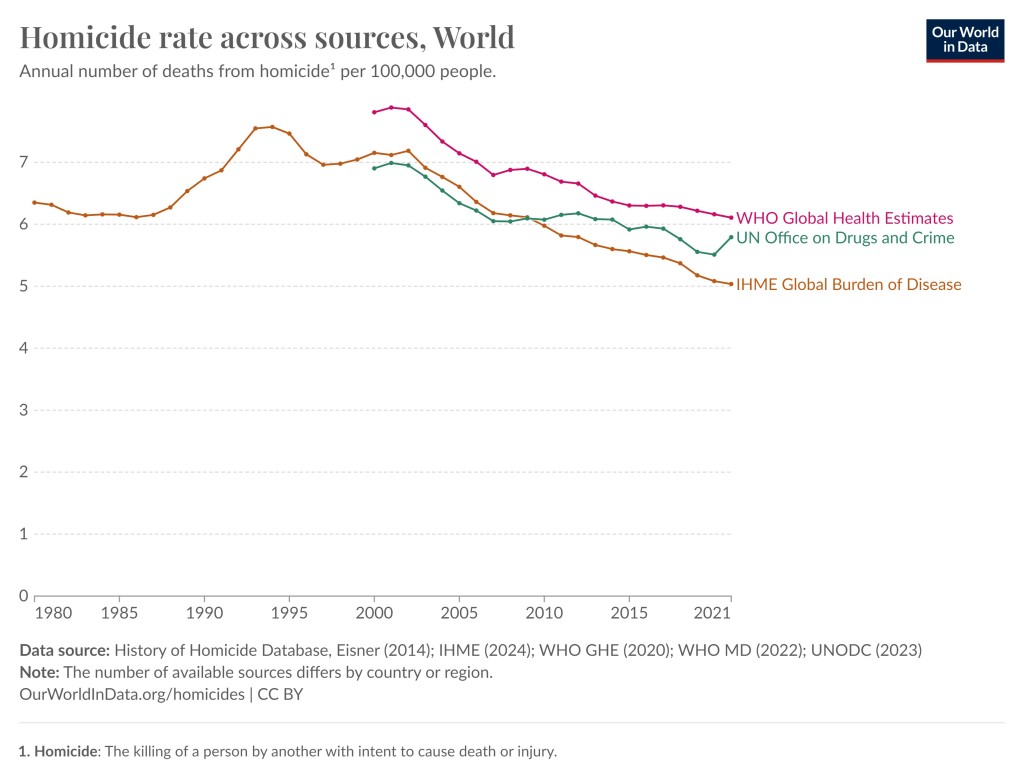
In this graph we can see that homicide rate worldwide has been reduced somewhat since the mid 1990’s. This graph is also taken from the Our World in Data website and they in turn used various databases from UN, WHO, etc.
Also remember that in the past there were a lot less people on earth, so relatively speaking a million deaths was a lot bigger number back then. In summary, despite all the wars going on, our world is less violent than it used to be.
Superfact 8 : US Violent Crime Nearly Cut in Half Since 1990
Despite all the news reports about rampant crime, the US violent crime rate has fallen to half of what it was in the early 1990’s.
I’ve known for a while that violent crime in the US has been going down substantially since 1990. However, quite often when I mention this people refuse to believe it. When I visit NextDoor, the hyperlocal social networking service for neighborhoods, I see people complaining about rising crime, and especially rising violent crime. The news media and the newspapers are filled with violent crime stories, murders, mass shootings, assaults, rape, and robberies. It seems to be getting worse and worse. We are living in scary times, aren’t we?
The Better Angels of our Nature
A couple of years ago I bought a book by Steven Pinker with the title The Better Angels of our Nature, why violence has declined, which contradicted the violence is getting worse narrative. In the book he claims that violence is trending down worldwide and that includes US violent crime.
In 1987 I received a Christmas present from the parents of a fellow student whom I had been tutoring. I was an exchange student to the United States from Sweden at the time. The Christmas present in question was the World Almanac of 1987. I loved it and ever since I’ve bought the World Almanac every year. If you open the pages for crime statistics in the United States in the World Almanac you see the same thing, violent crime in the US is declining.
The World Almanac and Book of Facts 2023.
Statistics
Below is what the World Almanac 2023 says about the violent crime rate per 100,000 residents in the United States (page 114). The data sources were : Federal Bureau of Investigation, U.S. Department of Justice, Uniform Crime Reporting Program, Crime in the United States 2020. I also included property crimes in the last column to show that non-violent crimes have declined as well.
Year
All violent crime
Murder and nonnegligent manslaughter
Rape
Robbery
Aggravated assault
All property crime (non-violent)
1990
729.6
9.4
41.1
256.3
422.9
5,073.1
1995
684.5
8.2
37.1
220.9
418.3
4,590.5
2000
506.5
5.5
32.0
145.0
324.0
3,618.3
2005
469.0
5.6
31.8
140.8
290.8
3,431.5
2008
458.6
5.4
29.8
145.9
277.5
3,214.6
2011
387.1
4.7
27.0
113.9
241.5
2,905.4
2014
361.6
4.4
26.6
101.3
229.2
2,574.1
2016
386.6
5.4
30.0
102.9
248.3
2,451.6
2017
383.8
5.3
30.7
98.6
249.2
2,362.9
2018
370.4
5.0
31.0
86.1
248.2
2,209.8
2019
368.6
5.1
31.4
81.8
250.4
2,130.6
2020
387.8
6.5
27.6
73.9
279.7
1,958.2
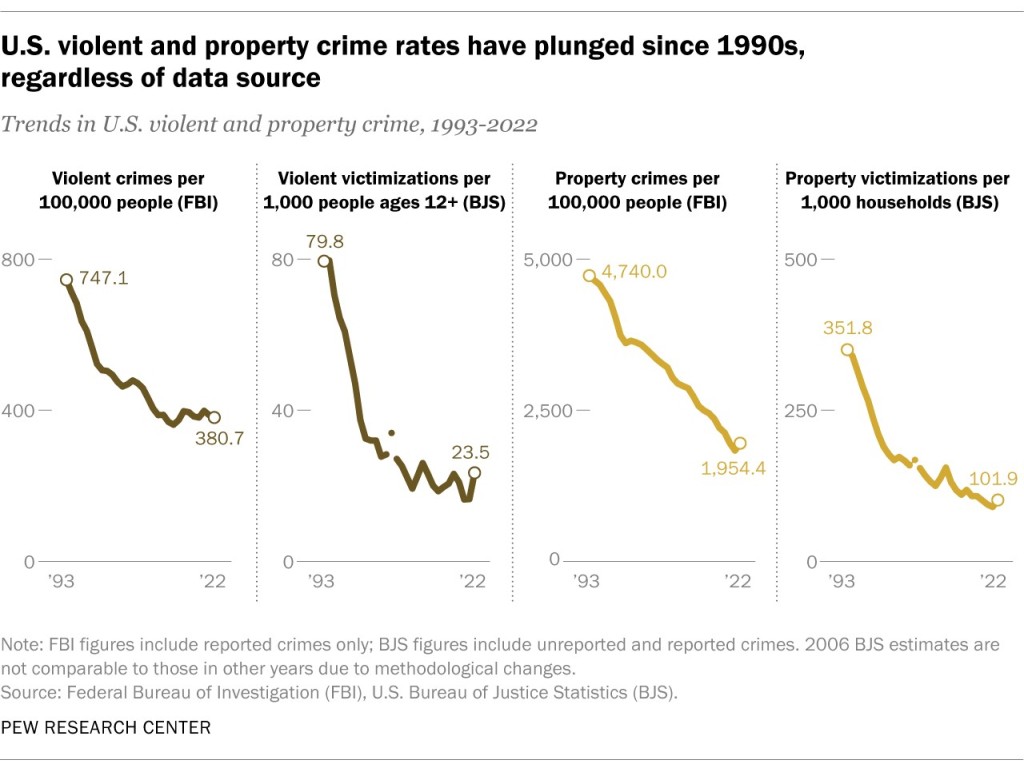
The graph below is taken from this article from the Pew Research Center tells the same story. The graph. It shows that the US violent crime rate has nearly halved since the 1990’s. There is a slight uptick in crime for the years 2020 and 2021 but according to this PBS article the downward trend has continued in 2022 and 2023.
The four graphs show that both violent crime and property crime has declined since 1990. Click on the picture to see the Pew Research article it is taken from.
Since this is a surprising fact that some does not even want to acknowledge (in my experience) I consider this a super fact.
Do you feel it is hard to believe that violent crime in the US has been declining over the last few decades?
Superfact 7 :Poverty and child mortality has been sharply reduced worldwide.
Extreme poverty as well as child mortality has been sharply reduced the world over. The countries that are the worst-off today are still better off than the countries that were doing the best at the beginning of the 19th century. Over the last 20 years extreme poverty and child mortality has continued to decline sharply.
In Hans Rosling’s book Factfulness, “Ten Reasons We’re are Wrong About the World – and Why Things Are Better Than You Think”, the author presented a quiz that he wanted the reader to take before reading the book. Below is the third question of the quiz. I should say that Hans Rosling posed this and other questions to thousands of people around the world.
In the last 20 years, the proportion of the World population living in extreme poverty has…
A. Almost doubled
B. Remained more or less the same
C. Almost halved
The correct answer is C. Almost halved. Around 7% of the quiz takers got the right answer. Around 5% in the United States got it right. That the proportion of the World population living in extreme poverty halved in 20 years is a true fact. This is also an important fact about the world. Despite that most people got it wrong. In fact, monkeys randomly picking answers would do better (33%). I did pretty well on this quiz, but since I was reading the book and the book’s title is “Ten Reasons We’re are Wrong About the World – and Why Things Are Better Than You Think”, I got some help just looking at the front cover. In any case, I think this fact qualifies as a super fact, as do the other fact below (There has been a steep decline in child mortality).
These are selected facts from the data.
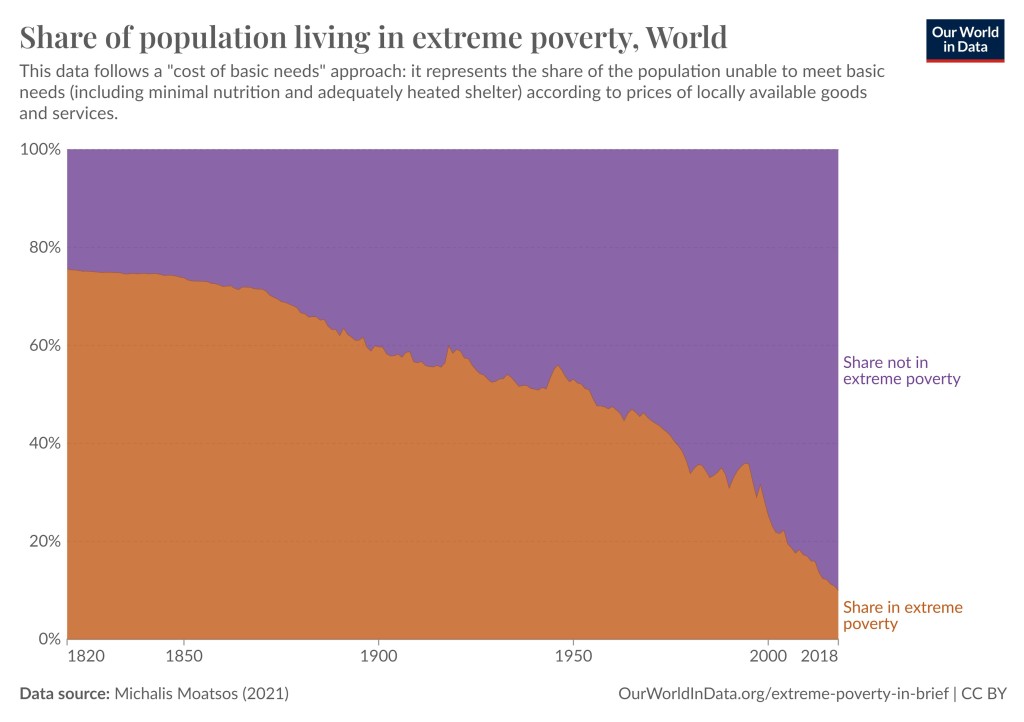
There has been a steep decline in extreme poverty
According to the World Bank and Our Data World in Data, an organization which makes data in databases easily accessible to public, extreme poverty went from almost 80% 200 years ago, 60% 100 years ago, about 45% 50 years ago, 34.3% 30 years ago, 23.6% 20 years ago, 8.4% in 2019, then it went up to 9% during the covid epidemic but it seems to be back down to a bit above 8% again. See the graph below as well as the two linked articles in this paragraph.
I should say that extreme poverty is (by the UN, World Bank, etc.) “a condition characterized by severe deprivation of basic human needs, including food, safe drinking water, sanitation facilities, health, shelter, education and information” and is currently defined to be below $2.15. In 2011 it was below $1.90.
This graph from Our World In Data shows a steep decline in extreme poverty over time. Click on the picture to visit the original article.
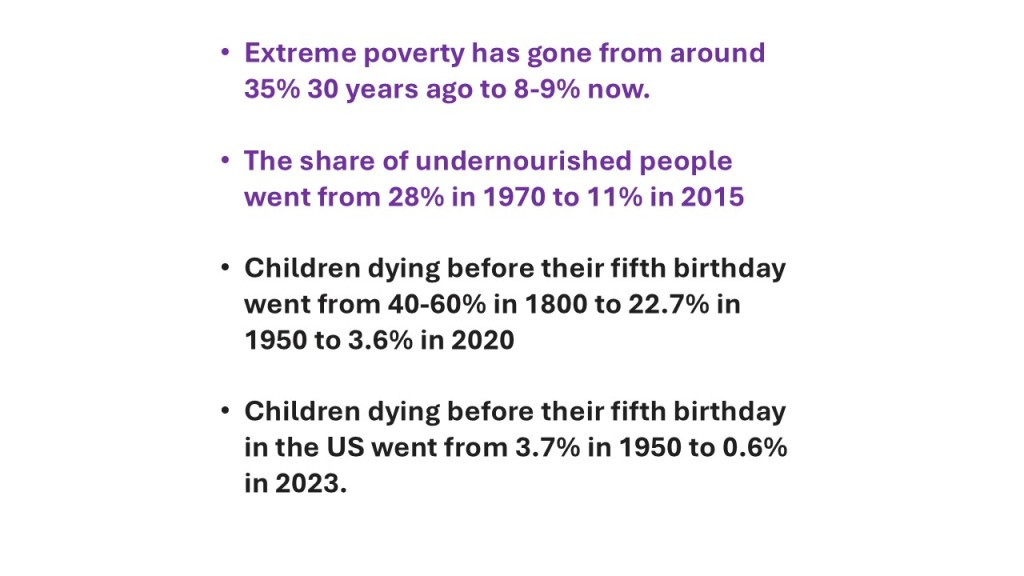
Other related statistics mentioned in Hans Rosling’s book is that the share of undernourished people went from 28% in 1970 to 11% in 2015. That is despite the earth’s growing population. Related to this is that cereal yield per hectare went from 1.4 ton in 1961 to 4 ton in 2014. This is due to modern agricultural techniques. The share of people with water from protected sources went from 58% in 1980 to 88% in 2015. This statistic was taken from WHO, UNICEF, the World Bank and FAO (the UN Food and Agriculture Organization).
There has been a steep decline in child mortality
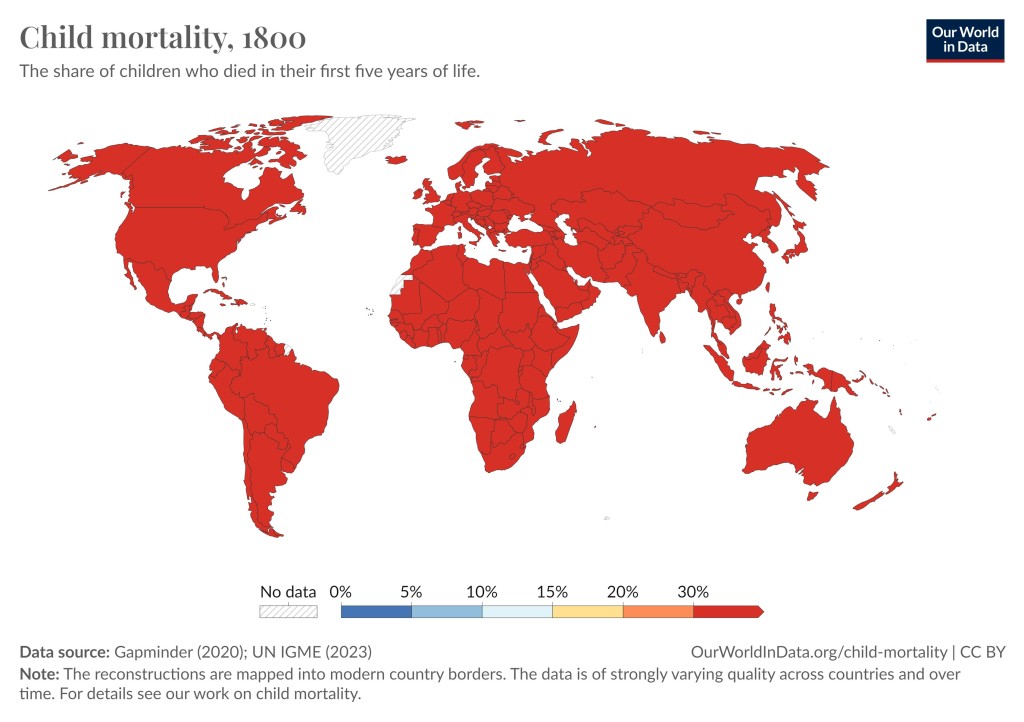
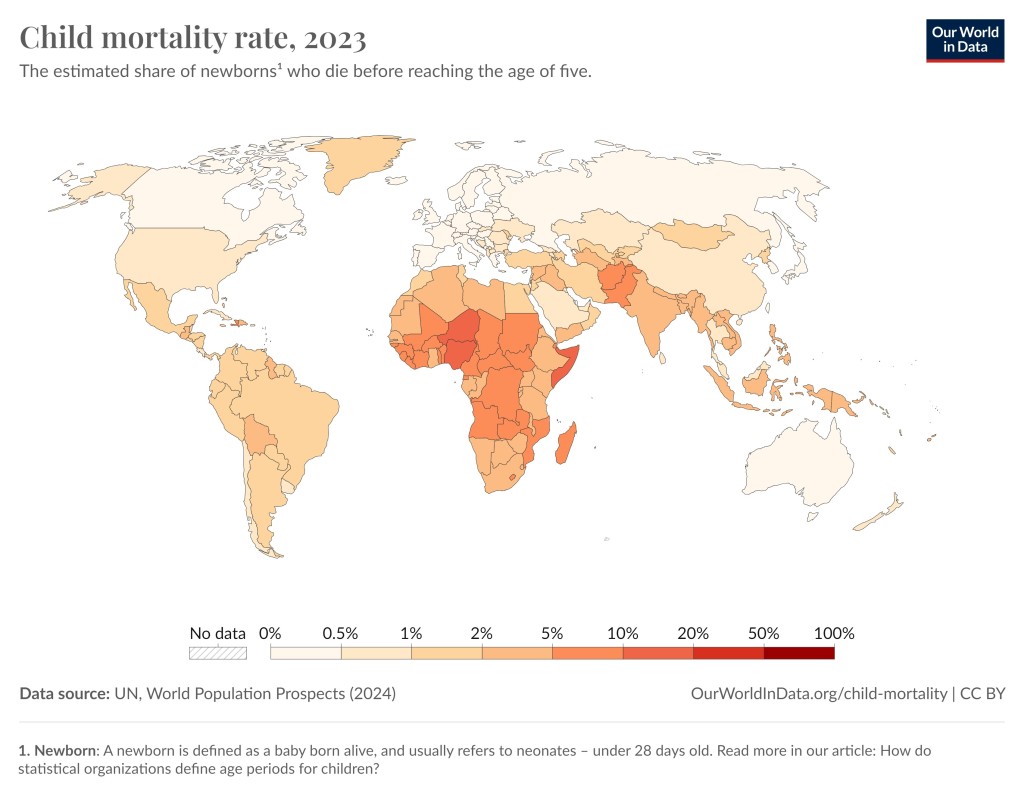
According to Hans Rosling’s book the percent of children dying before their fifth birthday went from 44% in 1800 to 4% in 2016. To get a more complete picture see these articles from Our World In Data, article1, article2, as well as the graph below. For most of humanities existence virtually all societies suffered a child mortality rate between 40% and 60%, but that changed drastically over the last 100 years.
Child mortality rate worldwide in 1800. Some of the data are estimates and may not be reliable. Data sources are UN IGME and Gapminder (an organization similar to Our World In Data).Child mortality rate worldwide in 2023. Niger has the highest child mortality rate of 11.6% and Iceland the lowest at 0.2%.Child mortality in in the world since 1950. The spike you see around the end of 1950 to 1960 is the great leap forward famine in China. In 1950 the child mortality rate was 22.7% and 2023 the child mortality rate was 3.6%.
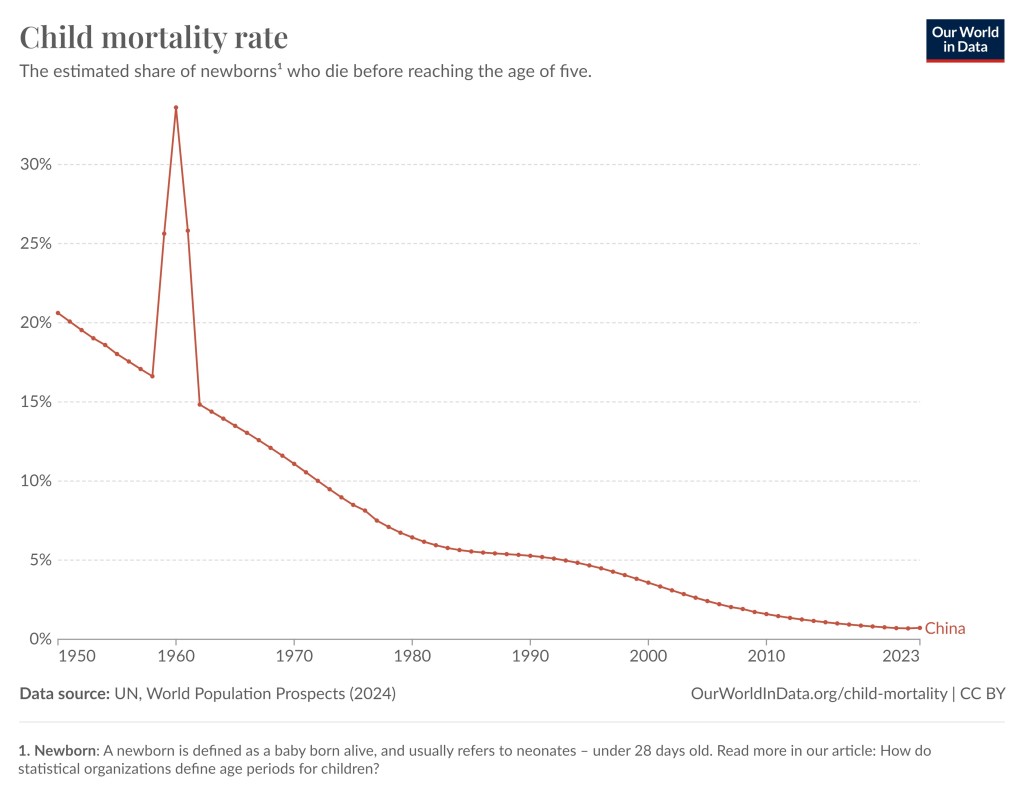
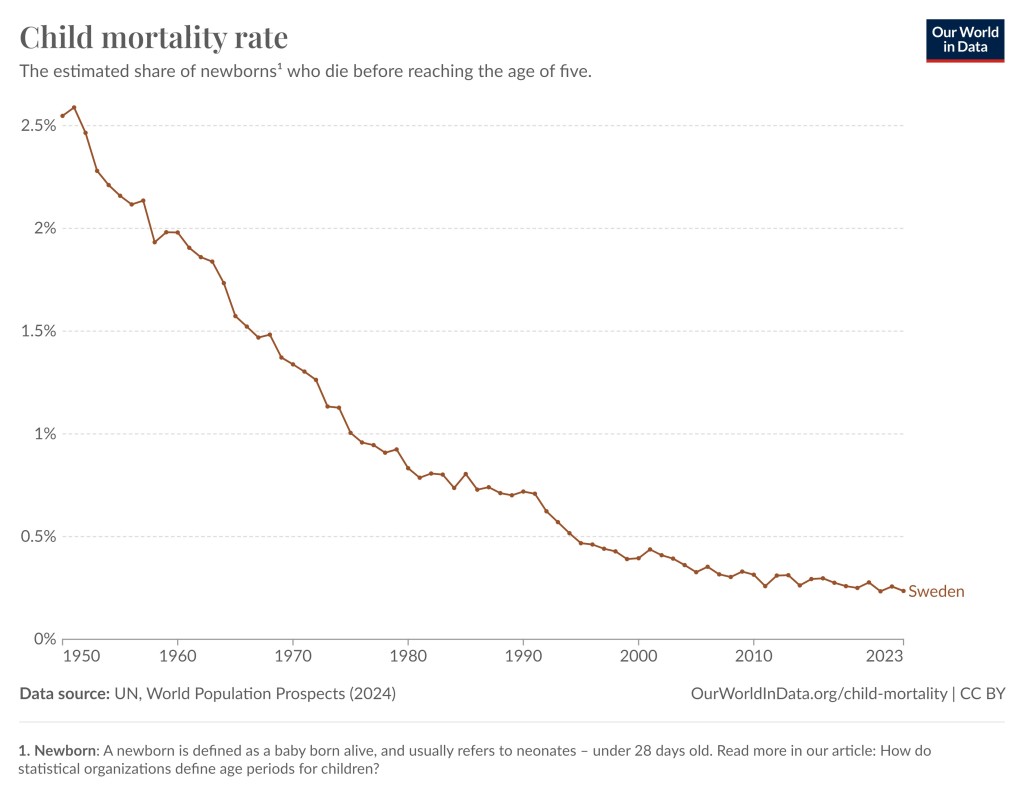
Below is the child mortality rate since 1950 for a few selected countries.
Child mortality in China since 1950. The large spike you see around the end of 1950 to 1960 is the great leap forward famine. 15 to 55 million died from starvation. In 2023 the child mortality rate was 0.7%.Child mortality in the United States since 1950 (3.7%). In 2023 the child mortality rate was 0.6%.Child mortality in Sweden since 1950 (2.6%). In 2023 the child mortality rate was 0.2%.